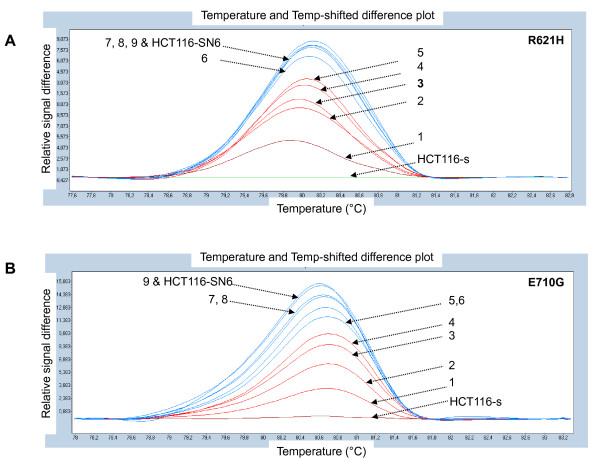
Figure 7.
Assessment of the sensitivity of the HRM analysis. A) p.R621H and B) p.E710G TOP1 mutations detected by HRM in HCT116-s (wild type) and HCT116-SN6 (mutant) cells and in mixtures of wild type and mutant cells: 1 = 10% mutant, 2 = 20% mutant, 3 = 30% mutant, 4 = 40% mutant, 5 = 50% mutant, 6 = 60% mutant, 7 = 70% mutant, 8 = 80% mutant, 9 = 90% mutant.

