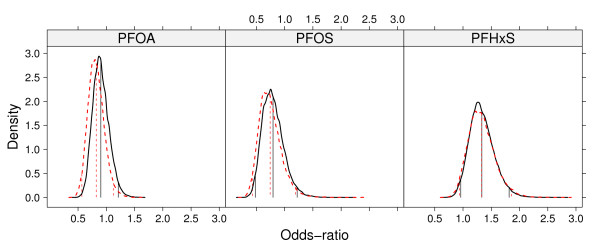
Figure 1.
Posterior distributions of ORs and credible intervals. Posterior distributions (curves), and corresponding posterior means and 95% equal-tailed credible intervals (vertical lines) of ORs based on the two models under the measurement error analysis. The solid curves/lines correspond to the simple model (ME-S) and the dashed curves/lines correspond to the model adjusted for confounding variables (ME-A).

