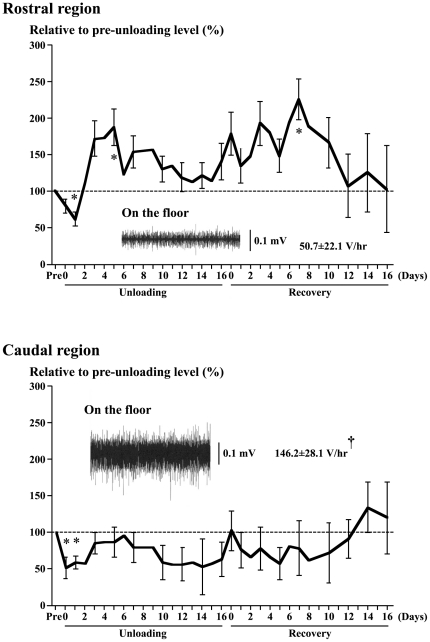
Figure 6. Time course changes of the mean (±SEM) electromyogram activities.
Absolute activity (V/hr) and activity relative to the pre-unloading (pre) level on the floor (100%) in the rostral and caudal regions of adductor longus muscle in response to hindlimb unloading and ambulation recovery are shown. n = 5 in each region. Further, typical EMG patterns and mean activity during quadrupedal rest on the floor are also shown. *: p<0.05 vs. pre-experimental level on the floor. †: p<0.05 vs. the rostral region.

