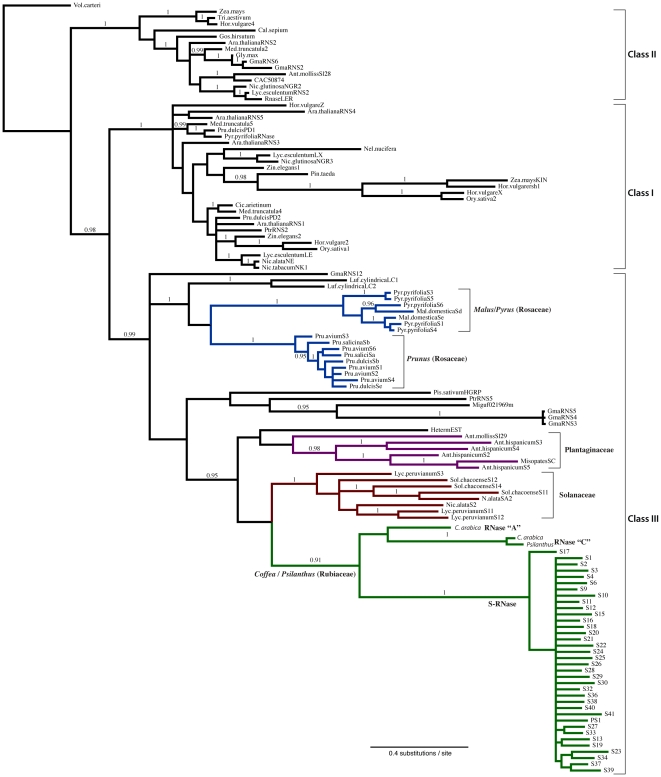
Figure 3. Phylogenetic relationships of plant RNase T2 genes.
The maximum a posteriori tree generated from a Bayesian phylogenetic analysis of RNase T2 amino acid sequences. Branches receiving a posterior probability of 0.95 or greater have been labeled. The Class III RNase T2 genes form a well-supported clade sister to an unresolved clade of Class I and II RNase T2 genes. S-RNase alleles from other GSI lineages are labeled and color-coded (Solanaceae in red; Plantaginaceae in purple; Rosaceae in blue), and all Class III S-Like RNases as well as all Class I and II RNases are shown in black. RNase T2 genes isolated from Coffea and Psilanthus species are shown in green. The tree shows that the Coffea genome contains three distinct RNase T2 genes labeled “A”, “C” and S-RNase. Note the significant sequence divergence (i.e. represented by long terminal branch lengths) between putative alleles of the S-RNase gene.

