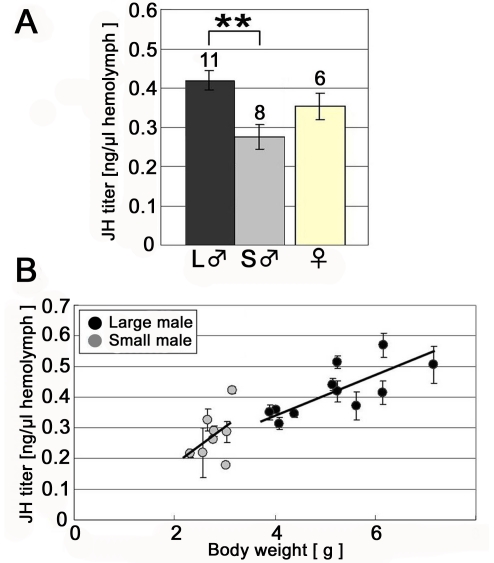
Figure 4. Comparison of JH titer between large and small males during the early prepupal period.
(A) JH titer during the early prepupal period (mean ± SE). A significant difference in JH titer was found between large and small males. Numbers above each column denote the number of examined individuals. (B) The relationship between body weight and JH titer in males in the early prepupal period. The shaded circles represent the average value of the three measurements for a single individual with a standard error bar. Among individuals under high food conditions (i.e. large males), a significant positive correlation between weight and JH titer was found (P = 0.012, R2 = 0.55, Pearson correlation coefficient test). However, individuals reared under low food conditions (i.e. small males) showed no significant correlation between weight and hormone titer, possibly due to a much narrower range of body weights observed (P>0.1, R2 = 0.21, Pearson correlation test).

