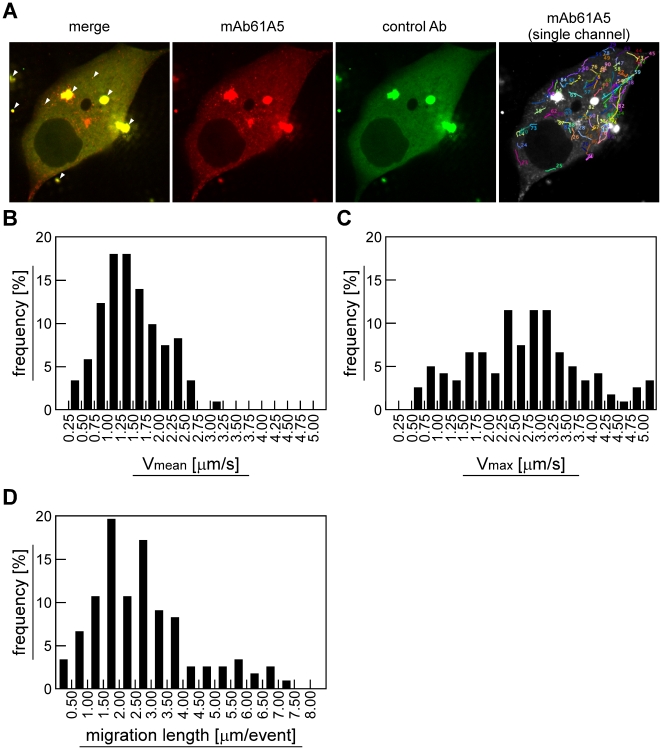
Figure 1. Live cell imaging of cytoplasmic vRNPs in infected MDCK cells.
(A) For live cell imaging, AF568-conjugated anti-NP mAb61A5 (red, mAb61A5) and AF488-conjugated non-specific mouse immunoglobulin (green, control Ab) were cotransfected to infected MDCK cells. Sequential images were acquired by the dual-color protocol and subsequently by the single-color protocol for kinetic analysis. Images were processed and analyzed by using ImageJ software and MTrackJ plugin (Video S1). A representative frame of the movie was shown (left 3 images). Pseudo-positive signals appeared in yellow in merged image (most left image, arrowheads). An example of signal tracking was shown as trajectories (most right image, mAb61A5 single channel). (B and C) Velocity distribution of vRNP signals. Mean and maximum velocities (Vmean and Vmax, respectively) of individual motile events were calculated and shown as histograms (Table S7, total 123 motile events derived from 75 trajectories). (D) Distribution of migration lengths. The migration lengths of individual motile events were shown as a histogram.

