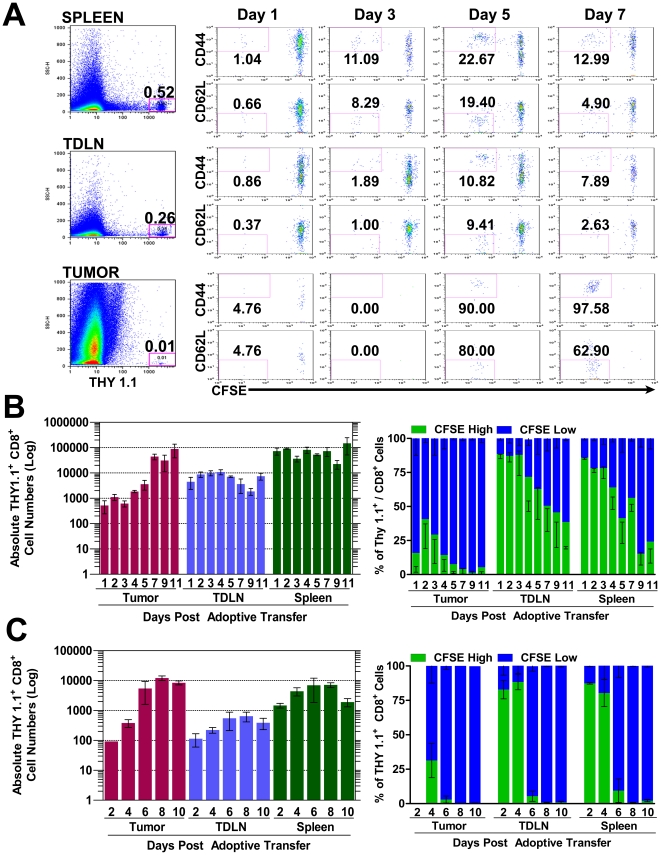
Figure 2. Naïve B16 specific Pmel-1 T cells are primed by tumor growth and infiltrate tumors after adoptive transfer into tumor bearing mice.
2.5×10⁵ B16 tumor cells were inoculated in matrigel into WT C57B/6 mice. Naive CFSE labeled Thy 1.1+ CD8+ Pmel-1 T cells were AT either 6 days (A, B) or 3 days (C) after tumor challenge. Spleens, TDLNs and tumors were isolated from 3 mice every 24–48 hours after AT for up to 11 days post transfer and analyzed for Pmel-1 T cell infiltration and activation (A) LEFT, representative SSC/Thy 1.1 FACS plots from 7 days post AT of 2×10⁶ naïve Pmel-1 T cells show percentages of infiltrating Thy 1.1+ Pmel-1 T cells. RIGHT panels shows CD44/CFSE, CD62L/CFSE on noted days post AT. Gates show representative percentages of activated (CD44High/CFSELow, or CD62LLow/CFSELow) Pmel-1 T cells infiltrating tissues at each time point. (B, C) Mean +/− SEM absolute numbers (left) and CFSE phenotype percentages (right) calculated from the SSClow Thy1.1+. gate. (B) AT of 2×10⁶ CD8+ Pmel-1 T cells (C) AT of 3×10⁵ CD8+ Pmel-1 T cells Percentages shown are representative of 2–3 independent experiments with 3 mice/timepoint.

