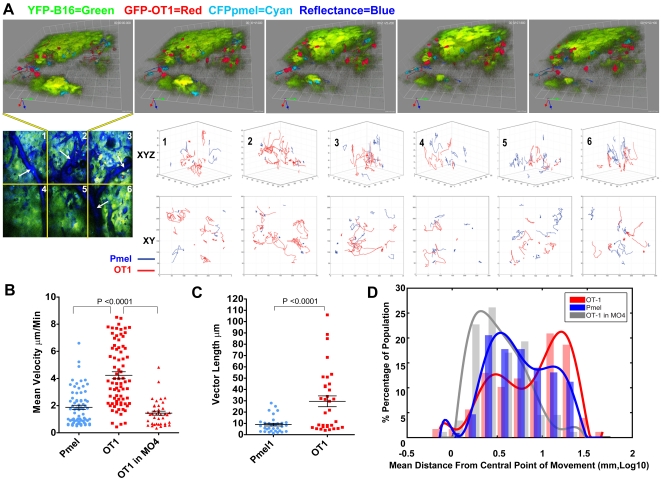
Figure 5. Intra-tumor mobility of Pmel-1 T cells is antigen specific.
1×10⁵ YFP-B16 tumor cells were injected in matrigel into WT C57B/6 mice with AT 3 days later of 3×10⁵ naive CD8+ CFP-Pmel-1, and 3×10⁵ naive GFP-OT-I T cells were AT into WT C57B/6 mice bearing 3 days old YFP-B16 tumors. 4 days later of 2.5×10⁴ LPS stimulated SIINFEKL loaded DCs injected into the contra-lateral footpad. (A) Representative image sequence from the 2nd region (top panel) of a 6 region time lapse image (bottom left image). Due to high density of YFP-B16 tumor mass, images and movies are displayed in 3D volumes instead of 2D projections to enable more accurate presentation of cell location respective to other. Likewise, reflectance data has been removed from top images in order to better facility presentation of fluorescence imagery. Ten min and 42sec separate each frame. Bottom; overlays of Pmel-1 (blue) and OT-I (red) T cell tracks, measured for at least 10 time points, corrected for image drift are shown for each region of the mosaic image. Top row shows 3D XYZ orientation, bottom row shows birds eye XY view. (B–D) Comparisons of mean velocity (B), 10 step vector length (C), mean distance from center point of movement (DCPM) (D) plotting each individual Pmel-1 and OT-I T cells tracked for at least 5 time points. Mean and SEM are shown for B and C, with a best fit curve over histogram of the population distribution show in D with modes of the populations being 0.4 mm, 0.1 mm and 0.4 mm in Log10 for Pmel-1 T cells, OT-1 T cells and OT-1 T cells in MO4 tumor respectively. N = 2 individual experiments, with 4 mice included in the data.

