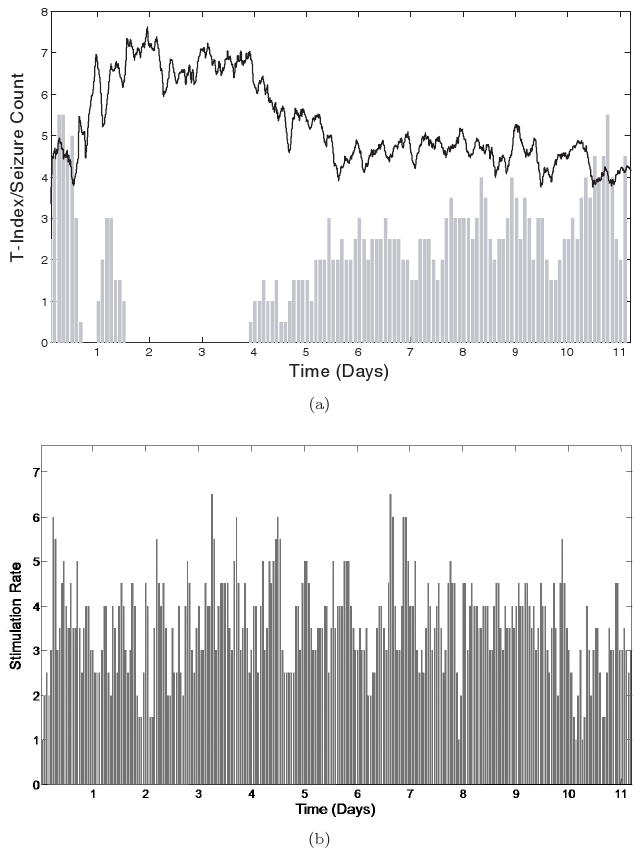
Fig. 6.

Brain dynamics of JIT seizure control in Rat 2 (Phase 2). (a) Top panel: The global T-index (solid black line) and the seizure frequency (# seizures in two-hour non-overlapping running windows — grey bars) are shown over time. It is observed that, when brain desynchronization (higher T-index values) exists, seizures are controlled (e.g. in days 1 to 4). However, when synchronization is higher (lower T-index values), seizure frequency is higher, which is indicative of ineffective seizure control. (b) Bottom panel: The delivered stimulus rate (#stimuli per 2 hour windows) over time.
