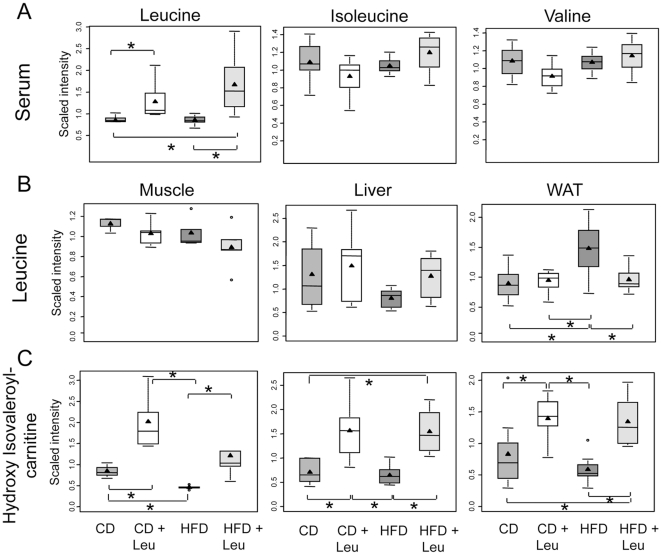
Figure 5. Changes in leucine metabolites in serum, muscle, liver and fat.
After 8 weeks on each diet, serum, hindlimb skeletal muscle, liver and perigonadal fat were obtained, extracted and subjected to non-targeted metabolomic analysis by UHPLC-MS/MS and GC-MS (Metabolon). Box-and-whisker plots of the relative levels of (A) serum leucine, isoleucine, and valine, (B) Leucine levels in muscle, liver and perigonadal fat, (C) Leucine catabolite hydroxyisovaleroylcarnitine metabolite levels in muscle, liver and perigonadal fat. 3–9 samples per group were used. *P<0.05. The X-axis shows the four groups (CD, CD+Leu, HFD, HFD+Leu) and the Y-axis shows the relative normalized intensity for the metabolites measured. Within the boxplot, the mean value is represented by the black arrowhead, the median by the horizontal dividing line, and the top and bottom of the box represent the seventy-fifth and twenty-fifth percentile, with the whiskers indicating the maximum and minimum points and outlier points shown as small circles.

