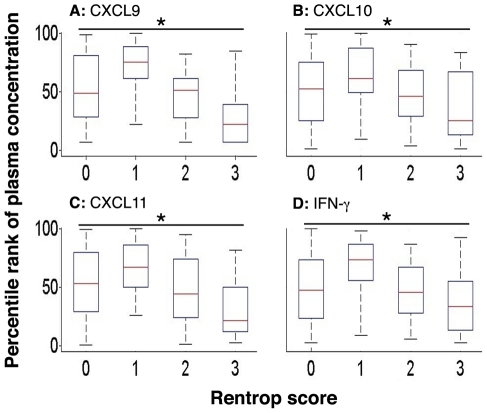
Figure 2. Box plots (median and interquartile range) of percentile rank of plasma concentrations of cytokines that inhibit vascular remodeling: CXCL9 (panel A), CXCL10 (panel B), CXCL11 (panel C), and IFN-γ (panel D).
All cytokines significantly correlated across increasing Rentrop scores: CXCL9 (*p<0.0001), CXCL10 (*p = 0.002), CXCL11 (*p = 0.0002), and IFN-γ (*p = 0.0004).

