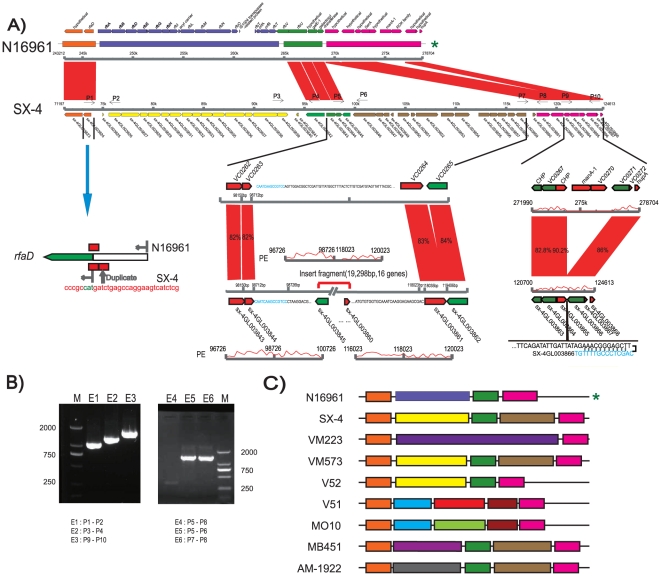
Figure 4. Comparison of the O-antigen biosynthesis cluster from V. mimicus strain SX-4 and V. cholerae strain N16961.
(A) The gene clusters are presented according to the chromosome with different color arrows. The colors of arrows are different units in genome rearrangement between V. mimicus and V. cholerae. P1 to P10, with black arrows, indicate primers designed to validate the structure. The left bottom figure shows the duplication in SX-4 in this region. The middle bottom figure presents the region and structure associated with genome exchange, as well as the flank. The red curve represents the pair-ends sequence relationship. The right bottom figure shows the downstream region of chromosome with a hairpin structure. (B) PCR results for structure validation. Primers were designed at the location marked in Figure 4A. (C) Scheme of clustering in other available genomes. For better describe the pattern of genome rearrangement in O-antigen region, the cluster were divided into different parts according to their similarity. The similar regions were showed with the same colors, and genes presented with the color bar are consistent with those in Figure 4A. * N16961 has been used as reference genome. PE curve is drawn by supporting pair-ends SOLEXA reads coverage.

