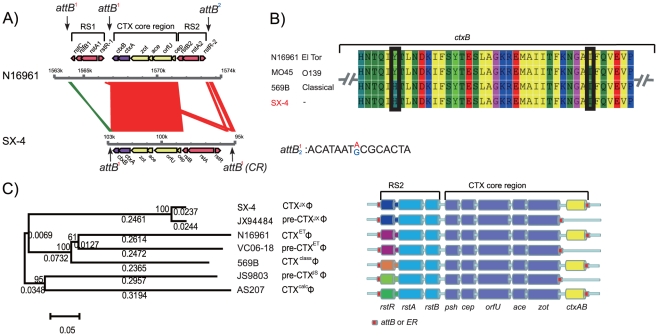
Figure 5. CTXΦ alleles and the phylogenetic tree for different strains of serogroups and biotypes.
(A) The CTX gene cluster compared to its associated region between SX-4 and N16961, as well as their flanking sequences. (B) Partial ctxB sequences show different mutations among the O1 and O139 serogroups. (C) The phylogenetic tree based on alignment results of rstR-ig2 sequences from the seven typical strains. The right portion is the modeled map for different types of CTXФ genomes.

