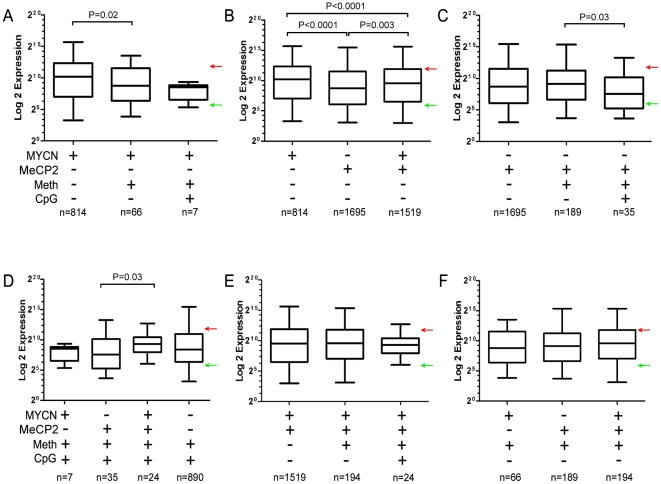
Figure 3. Gene expression analysis of the kelly cell line.
(A) A bar chart representing the median expression levels of genes whose promoter regions are bound by MYCN. The dataset was subdivided into unique MYCN sites, hypermethylated MYCN sites and hypermethylated MYCN sites associated with CpG Islands. (B – F) Similar analysis was performed for genes having promoters with different combinations of features (MYCN +/−; MeCP2 +/−; methylation +/− and/or CpG island +/−). Red arrows and green arrows denote the upper and lower quartiles of expression from the overall gene expression microarray results. Genes with expression values which fall in the upper quartile are considered highly expressed while genes which fall in the lower quartile are considered silent or expressed at low levels. Statistical analysis was performed using Mann-Whitney nonparametric test.

