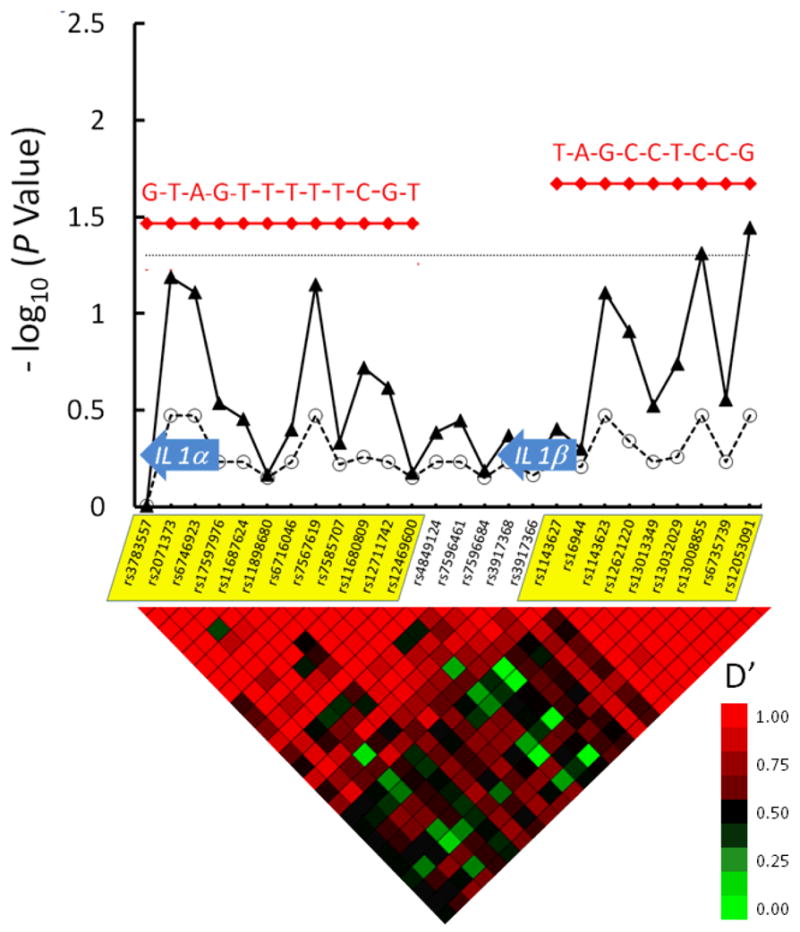
Figure 4. IL1α and ILβ Haplotypes May Increase or Decrease Factor VIII Inhibitor Risk.

26 tag SNPs are shown along the X axis, in their genomic order. The IL1α and IL1β chain genes are depicted with block arrows. Two major haplotype blocks in this region are indicated by yellow shading of the tag SNPs on the X-axis. The -log10 of the raw P value for each tag SNP and their corresponding FDR values that accounts for multiple hypothesis testing are depicted with closed triangles connected with solid line and open circles connected with dashed line, respectively. The dotted horizontal line indicates a significance level of P = 0.05. Haplotypes are indicated in red. Nucleotides at polymorphic sites in each haplotype are indicated in red. The heat map at the bottom of the figure denotes pairwise linkage disequilibrium (LD) values (D′) between tag SNPs. High LD (red color) indicate lack of evidence for recombination between pairs of SNPs, while low LD (green color) indicates recombination between pairs of SNPs. Tracing the squares below a tag SNP in a diagonal direction gives an indication of the LD between that SNP and its neighbors.
