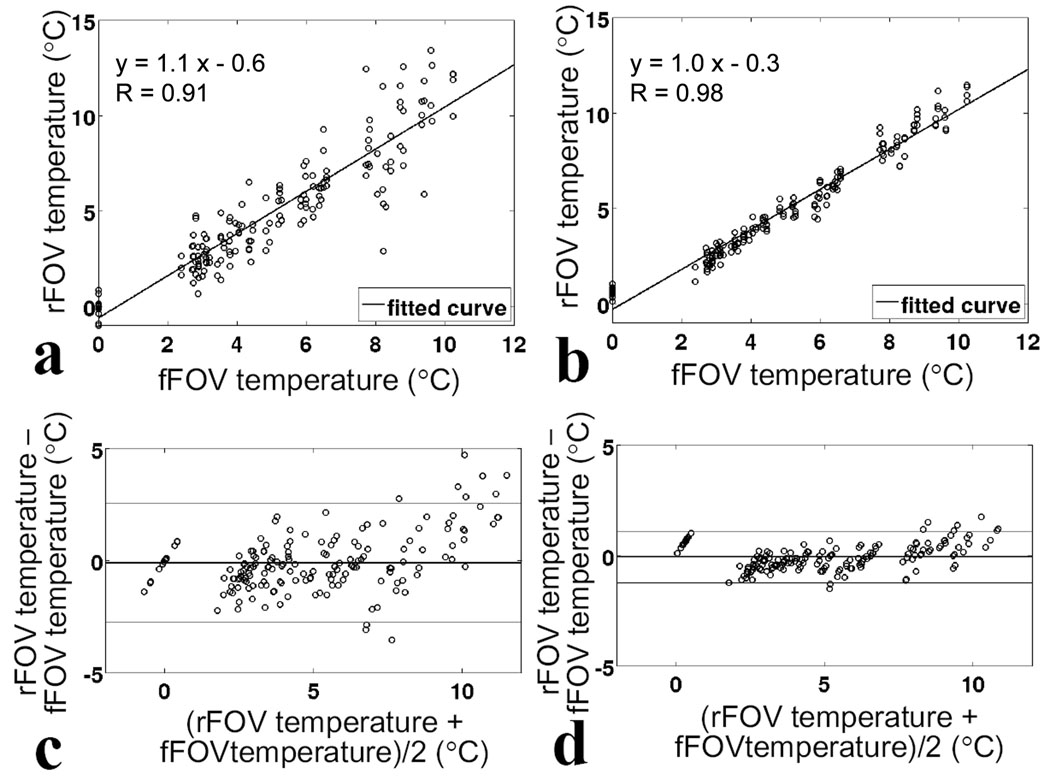
Fig. 6.
Scatterplots (a, b) and Bland-Altman plots (c, d) comparing of temperature measurements obtained using the present accelerated method with those obtained using full FOV SPGR sequence for 168 measurements acquired during 14 sonications. a),c), comparison using individual measurements from accelerated sequence. b),d), comparison using time-averaging over 24 frames in the rFOV measurements. The mean difference between measurements for the time-averaging scenario remained at 0.1°C, while standard deviation was reduced from 1.4°C to 0.6°C. In a and b, solid lines represents linear regression. In c and d, solid lines represent average difference, upper and lower lines represent ±1.96 standard deviations (95% confidence intervals).

