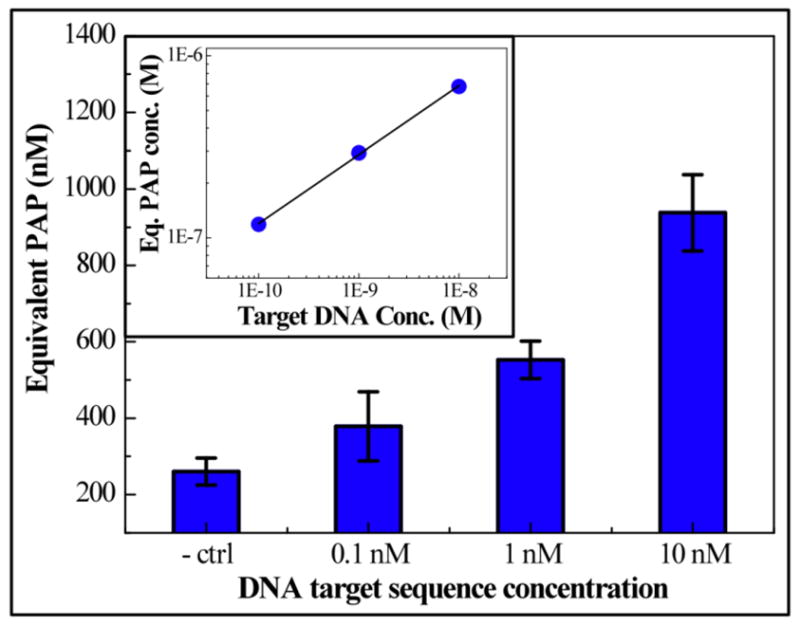
Fig. 5.

A monotonic increase of generated PAP is found as target DNA concentration increases from zero to 1.0 × 10⁻⁸ M. A significant difference is found between control and 1.0 × 10⁻¹⁰ M chips (P=0.05). Error bards are the standard deviation of 3 parallel measurements. Oxidation current is converted into equivalent PAP concentration using zero and 1.0 × 10⁻⁶ M PAP as calibration points. Inset: On log-log scale (axes are same as the big plot), equivalent PAP concentration shows a linear dependence on target DNA for concentrations between 1.0 × 10⁻¹⁰ and 1.0 × 10⁻⁸ M.
