
Figure 2.
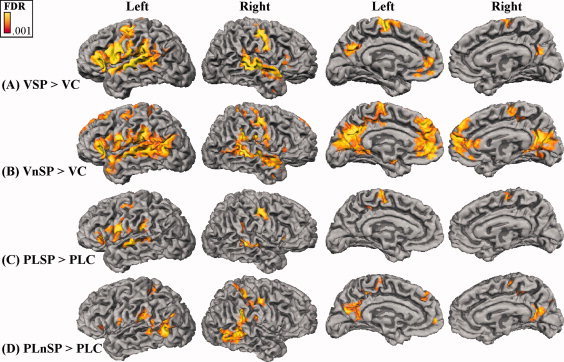
Whole‐brain activations projected onto the folded cortical surface, with the FDR threshold = 0.001, and cluster size = 25. A: VSP contrasted with its control, VC. B: VnSP contrasted with its control, VC. C: PLSP contrasted with its control, PLC. D: PLnSP contrasted with its control, PLC. (VSP, video speech; VnSP, video nonspeech; VC, video control; PLSP, point‐light speech; PLnSP, point‐light nonspeech; PLC, point‐light control).