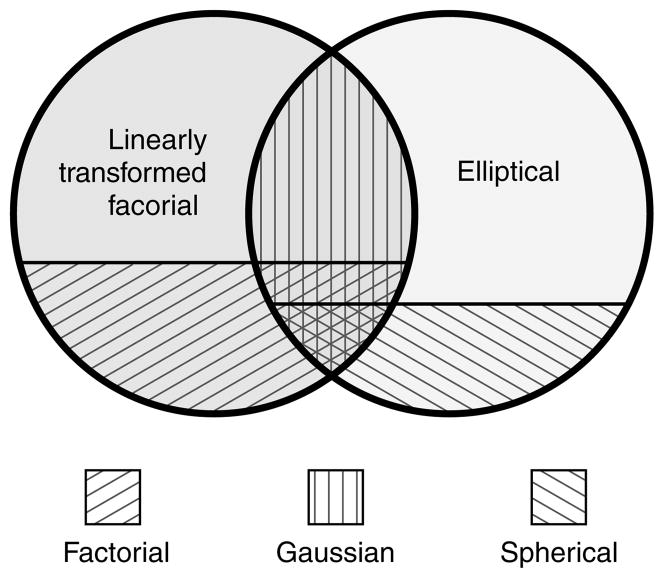
Figure 2.
Venn diagram of the relationship between density models. The two circles represent the two primary density classes considered in this article: linearly transformed factorial densities and elliptically symmetric densities (ESDs). The intersection of these two classes is the set of all gaussian densities. The factorial densities (i.e., joint densities whose components are independent) form a subset of the linearly transformed factorial densities, and the spherically symmetric densities (SSDs) form a subset of the ESDs.

