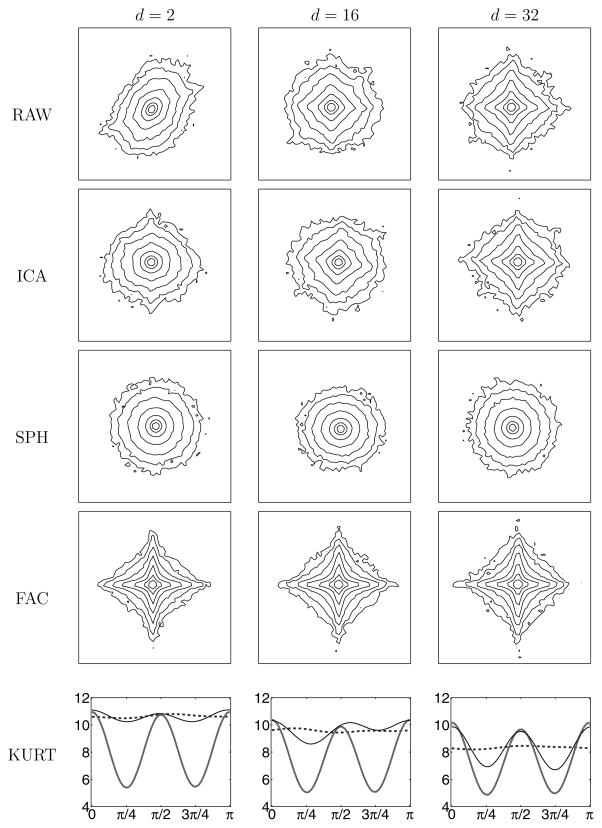
Figure 4.
Joint histograms of pairs of samples from transformed images, at three different spatial separations. Lines indicate level sets of constant probability, chosen such that a gaussian density will have equispaced contours. Data taken from a single test image. RAW: original bandpass filtered image. ICA: data after ICA transformation. SPH: sphericalized synthetic data (randomized directions). FAC: factorialized synthetic data (independently sampled marginal components). KURT: kurtosis of marginal density, as as function of marginal direction, for RAW (thin line), SPH (dashed line), and FAC (thick line) data.

