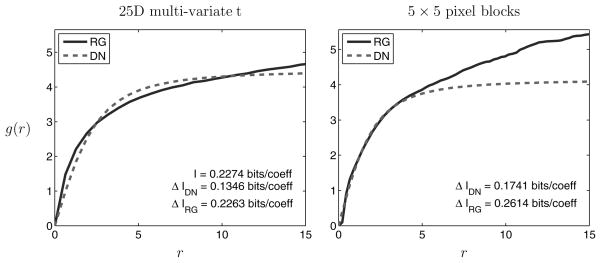
Figure 8.
Comparison of radial transforms corresponding to RG (solid line) and DN (dashed line), each optimized to minimize MI for 105 samples of a 25-dimensional spherical Student’s t density (left), and 5 × 5 pixel blocks taken from one bandpass-filtered test image (right). Average MI reduction is indicated for each transform.

