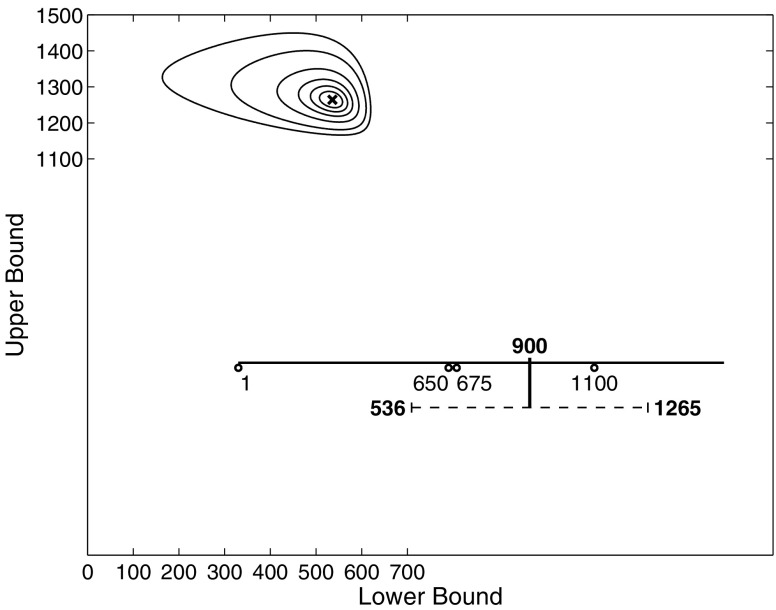
Fig. 3.
Forming an aggregate estimate from bids, based on inference using a decision-making model. The contour plot shows the distribution over inferred lower and upper bounds for the price range knowledge shared by players. The inset shows the actual bids (circles), the most likely bounds ($536 and $1,265), and the center of these price bounds ($900), which corresponds to the model-based aggregate of the bids

