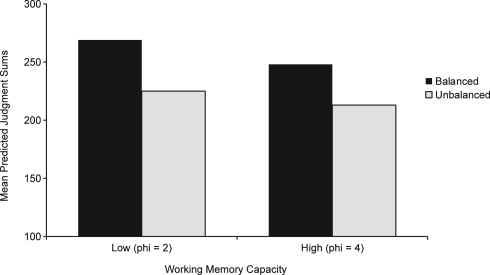
Figure 1.
Mean predicted sum of probability judgments as a function of the strength of alternative hypotheses and working memory capacity for the HyGene simulation. The distribution of alternatives for the balanced condition was: 10, 5, 5, 4, 4, 4, 4, 1. The distribution for the unbalanced condition was: 15, 10, 7, 1, 1, 1, 1, 1.

