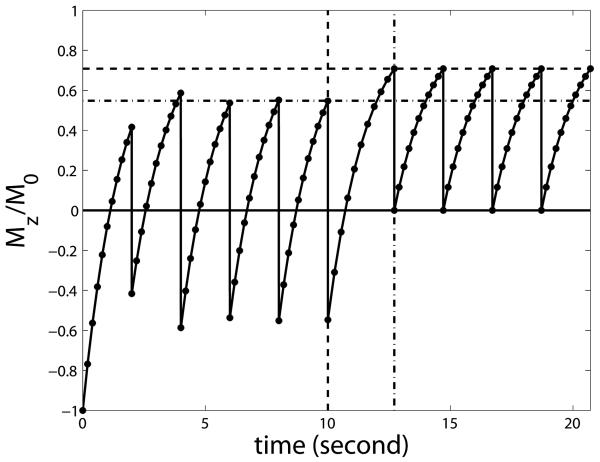
Fig. A1.
Numerical simulation of the steady state buildup process for inverted inflowing blood using the Bloch equation. The vertical axis is the normalized longitudinal magnetization. The horizontal dash dot and dashed lines indicate the first (Eq. [A3]) and second (Eq. [A7]) steady states derived in the Appendix I, respectively. The vertical dashed line marks the time point when the blood leaves the inversion slab. The vertical dash dot line indicates the second TI after the blood leaves the inversion slab. Note that this figure is intended to show the general situation for steady state inflow blood and the timing does not correspond to any specific inversion geometry.

