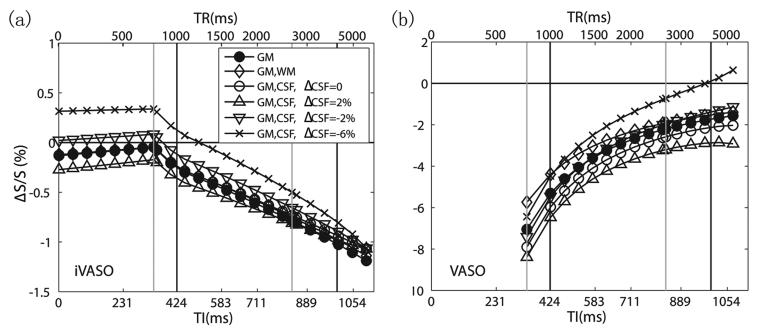
Fig. 3.
Influence of partial volume effects from WM (5%) and CSF (10.5%) and from changes in CSF volume during activation on the relative GM parenchymal signal change in iVASO (a) and VASO (b). Note that the vertical scale for VASO is greater than for iVASO. The corresponding TIs and TRs are indicated at the bottom and top, respectively. The black and gray vertical lines mark the transit times used in the simulations during baseline and activation, respectively, with the two left lines corresponding to Δ and the two right lines to Δ + δa.

