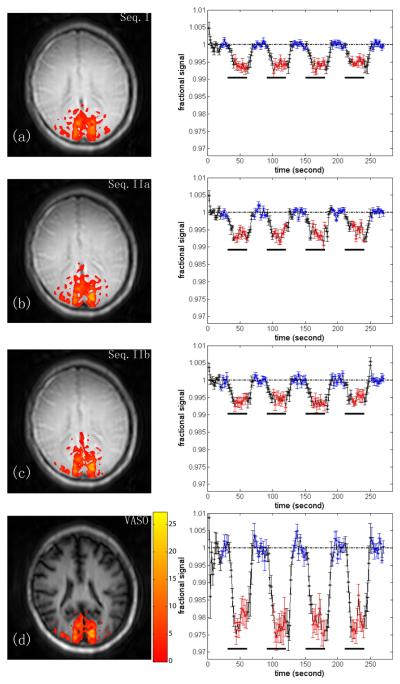
Fig. 4.
Visual activation results for TR= 2s. Representative activation maps and subject-averaged hemodynamic responses (n=7) for sequences I, IIa, IIb and VASO, respectively. The color overlays indicate Z-score according to the bar displayed beside the bottom image. The error bar indicates the inter-subject standard deviation. The black bars underneath indicate the stimulus periods. Red and blue points indicate points included in activation detection and baseline signal calculation, respectively.

