
Table 2.
Diagnostic Performance of QISS Nonenhanced vs Contrast-enhanced MR Angiography
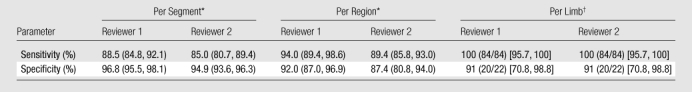
Note.—Data are values of the diagnostic performance of nonenhanced MR angiography, as compared with contrast-enhanced MR angiography, in the detection of significant (≥50%) stenosis.
*
Per-segment and per-region analyses were performed with GEE modeling. Per-segment analysis was based on data from a total of 1516 segments. Per-region analysis was based on data from a total of 348 regions. Numbers in parentheses are 95% CIs.
†
Per-limb analysis was based on data from a total of 106 limbs. Absolute numbers of limbs used to calculate the percentages are in parentheses, and 95% CIs are in brackets.