
Table 4.
Comparison of Likert Scores for Diagnostic Image Quality
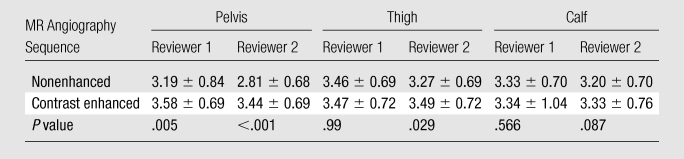
Note.—Data are mean Likert scores ± standard deviations, compared between contrast-enhanced MR angiography and nonenhanced MR angiography in the pelvis, thigh, and calf regions. P values were derived by using the paired t test.