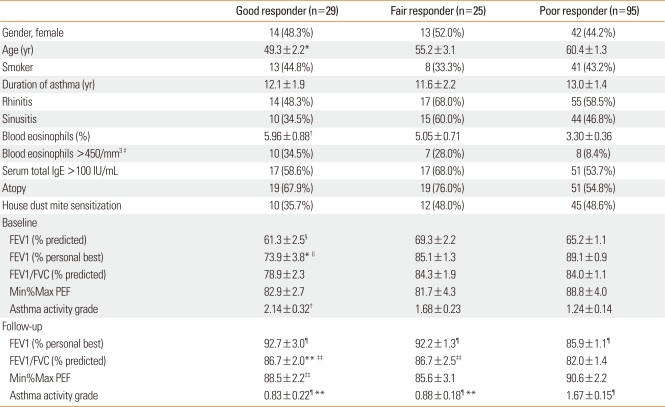
Table 3.
Clinical characteristics of subjects with asthma classified according to their response to BCG vaccination
*P<0.001, †P<0.01, **P<0.05, compared with poor responder.
‡P<0.05, chi-squared test.
§P<0.05, ∥P<0.01, compared with fair responder.
¶P<0.001, ††P<0.05, ‡‡P<0.01, compared with baseline.
Asthma activity was graded using one point for every 6% fall in FEV1 from the personal best value or every 10% fall of minimal to maximal peak expiratory flow (Min%Max PEF).

