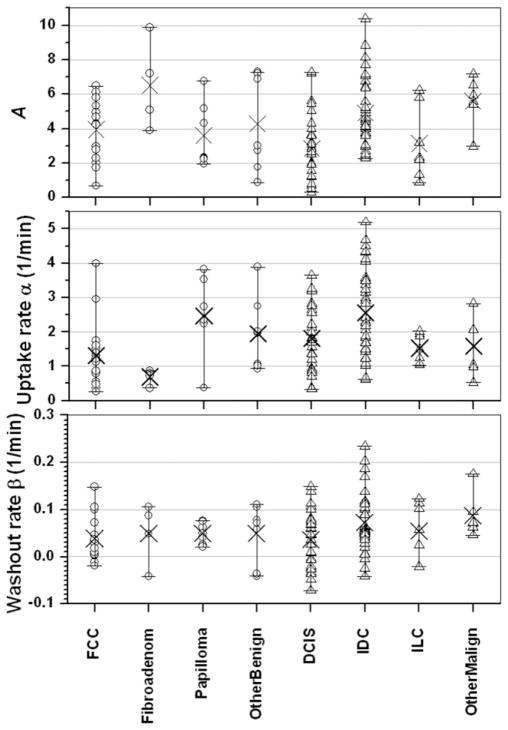
FIG. 2.
The distributions of the primary EMM parameters are shown according to lesion type. From top to bottom the primary EMM parameters are the amplitude A, the uptake rate α, and the washout rate β. The open circles display the values of the primary EMM parameter for every case in that subtype of benign lesion, and × marks the average value: fibrocystic change (FCC, n = 16), fibroadenoma (n = 4), papilloma (n = 7), and other benign (n = 7). Similarly, the open triangles represent the values of each primary EMM parameter for every case in that subtype of malignant lesion, and × marks the average value: ductal carcinoma in situ (DCIS, n = 30), invasive ductal carcinoma (IDC, n = 36), invasive lobular carcinoma (ILC, n = 7), and other malignant (n = 6).

