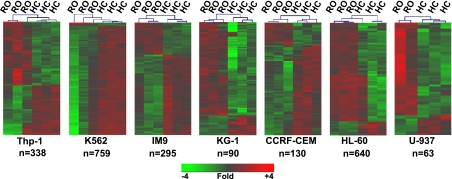
Fig. 2.
Each of the 7 cell lines display distinct expression signatures distinguishing the response of RO plasma and HC plasma. For each cell line, lists of differentially expressed genes were defined as probe sets exhibiting a |log2 ratio| > 0.5, (mean absolute 1.4-fold change between RO and HC inductions) and a rank product false discovery rate < 10%. Two-way hierarchical clustering was conducted using these gene lists differentially regulated in each cell line. The lineage of each cell line and the number of genes meeting the cutoff for differential expression are indicated below each cluster picture. For the U-937 cell line, 1 of the 3 RO samples was removed as it was flagged as an outlier during the initial QC analysis. The scale denotes fold of change relative to the intensity value across all replicates of each cell line.

