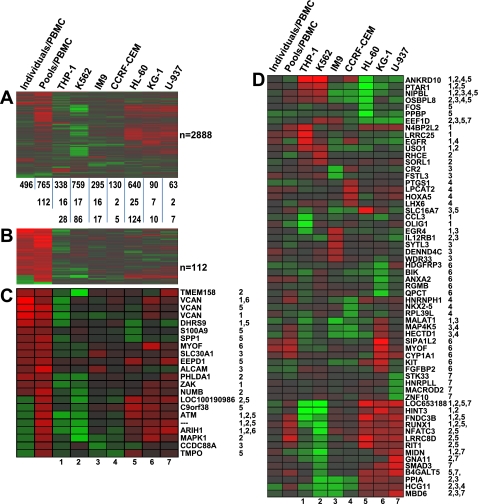
Fig. 3.
Comparison of expression signatures between cell lines and the fresh peripheral blood mononuclear cells (PBMC). A: 1-way hierarchical clustering (genes only) was conducted on a gene set encompassing the union of the differentially expressed (DE) genes (RO vs. HC) identified among the 7 cell lines and fresh PBMC (2,888 unique genes). The number of DE genes in each experimental condition is indicated below the heat map. The number of genes in the signature of each cell line that overlap with the 496 or 765 gene signatures observed in fresh PBMC challenged independently or with plasma pools are indicated below the heat map. B: 1-way hierarchical clustering (genes only) on the 112 genes commonly regulated in fresh PBMC challenged independently or with plasma pools. C: 1-way hierarchical clustering (genes only) on a set of 22 genes (among the 112 genes illustrated in B) that were differentially expressed in fresh PBMC as well as in at least 1 of the 7 cell lines. Each of the 7 experimental conditions in this heat map is given a number (1 through 7) as indicated below the heat map. The numbers next to each gene symbol indicate the cell line/s in which that gene was differentially expressed. D: genes with the top 10 ranks within each cell line (5 most upregulated and 5 most downregulated) were extracted, merged, duplicates removed (n = 61), and subjected to 1-way hierarchical clustering along with the expression trend in fresh PBMC. The numbers next to each gene symbol indicate the cell line/s in which that gene was differentially expressed.

