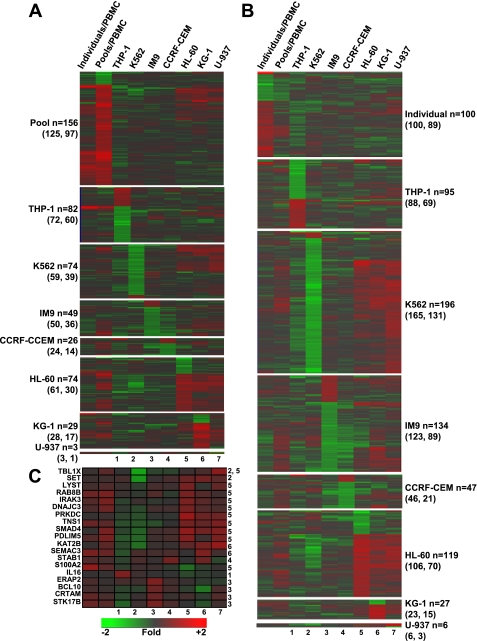
Fig. 5.
Functional analysis of cell line signatures. Candidate gene prioritization with ToppGene was conducted for each cell line using the significantly regulated probe sets defined in Table 3. Analyses were conducted with training lists consisting of either the 233 regulated probe sets [|log2 ratio| > 0.58, P < 0.01, false discovery rate (FDR) < 0.01] identified when PBMC were cultured with individual RO and HC plasma (60) (A) or the 765 regulated probe sets (|log2 ratio| > 0.5, FDR < 0.10) (B) identified when PBMC were cultured with pooled RO and HC plasma. The number of significantly identified (P < 0.01) functionally related candidate probe sets are indicated. In parentheses are indicated the total number of genes identified and the total number of unique genes identified. C: a selection of annotated genes related to immunological activation, signal transduction, or transcriptional regulation. Each of the 7 experimental conditions in this heat map is given a number (1 through 7) as indicated below the heat map. The numbers next to each gene symbol indicate the cell line/s in which that gene was differentially expressed. The scale denotes fold of change relative to the intensity value across all replicates of each cell line.

