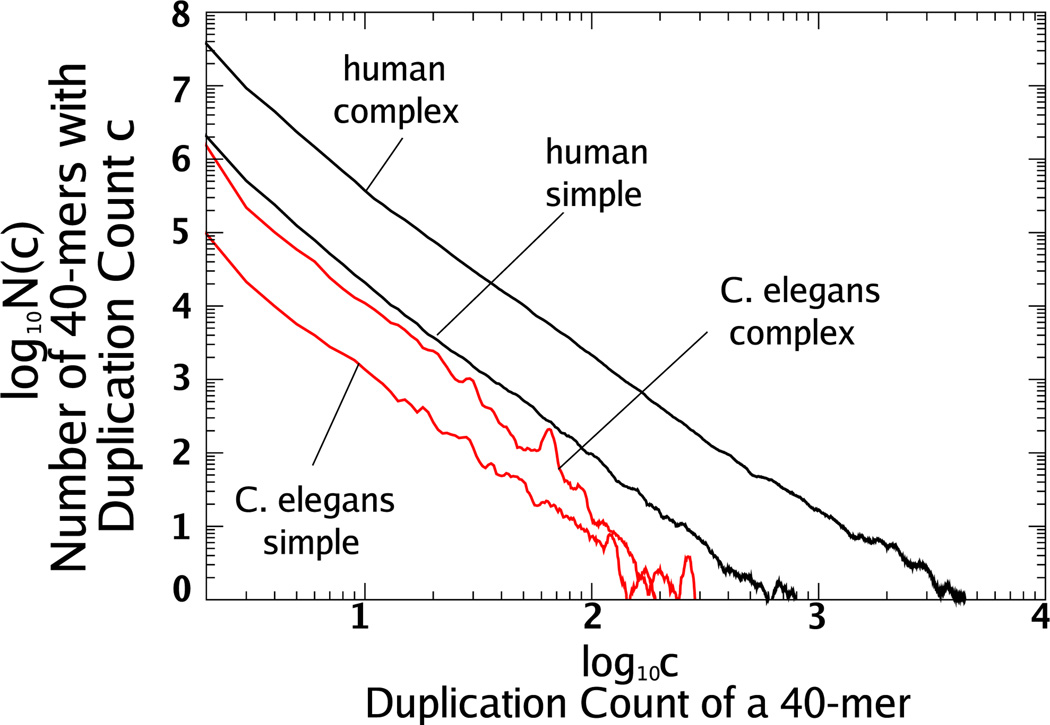
FIG. 4.
(Color online) We show both the simple and complex 40-mer duplication count distributions for the human genome and C. elegans with a moving average as in Fig. 1. All simple and complex distributions follow similar power-law-like distributions for the range of 3 ≤ c ≤ 100.

