
Fig. 2.
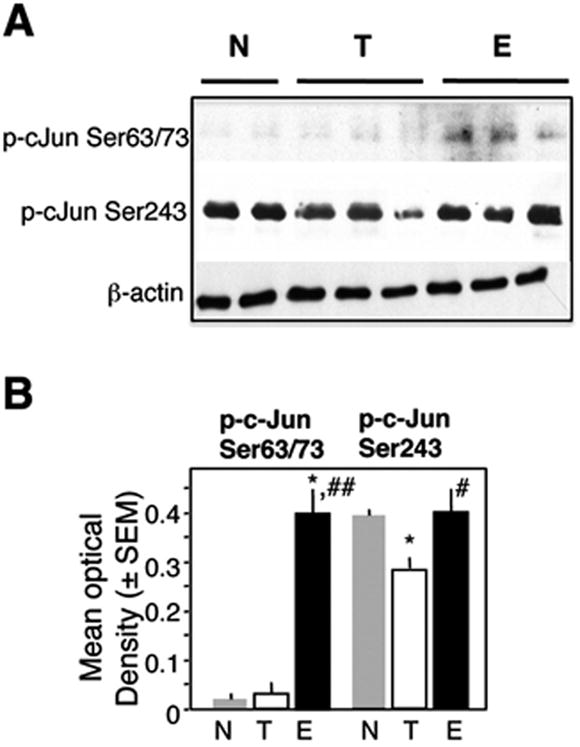
Phosphorylation of c-Jun during extinction. (A) The levels of p-c-Jun Ser63/73 were undetectable in the N and T groups and significantly increased in the E group (F2,15 = 9.65, p < 0.001). p-c-Jun Ser243 was decreased in the T group and returned to control, levels in the E group (F2,15 = 4.12, p < 0.01). (B) Quantification of the immunoblot data. Statistically significant differences: *p < 0.01 vs N, #p < 0.01 vs E, ##p < 0.001 vs E.