
Fig. 1.
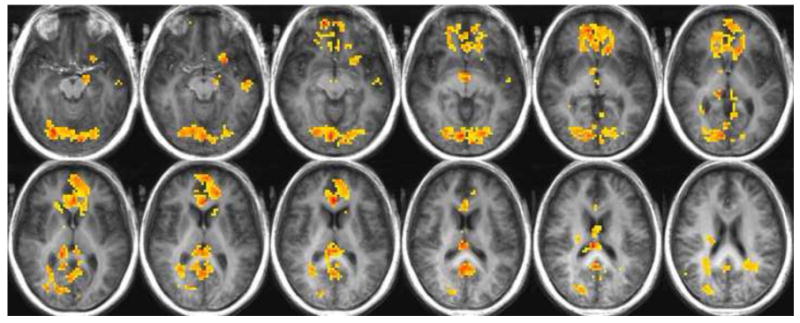
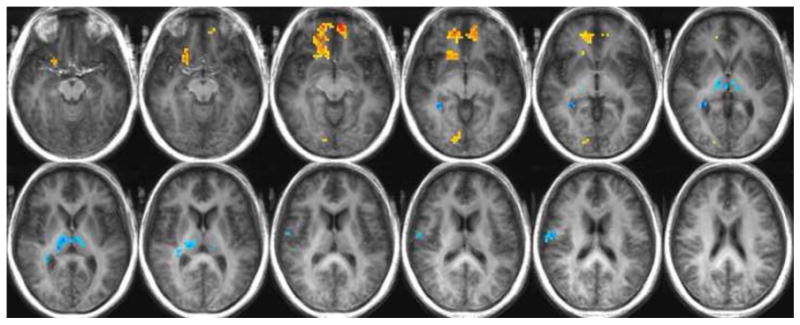
Fig. 1a. Regions of significantly increased or decreased activity in the older adults relative to the young adults while in a state of hunger in response to all stimuli: warm colors indicate greater activity in the older adults; cool colors indicate a greater response in the young adults.
Fig. 1b. Regions of significantly increased or decreased activity in the older adults relative to the young adults while in a state of satiety in response to all stimuli: warm colors indicate greater activity in the older adults; cool colors indicate a greater response in the young adults.