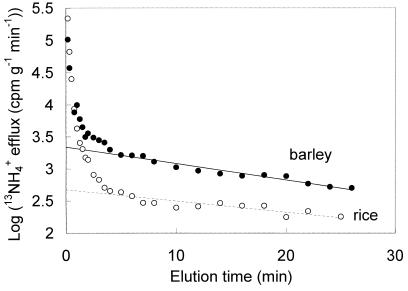
Figure 1.
Semilogarithmic plots of 13NH efflux from
the cytosolic compartments of barley and rice roots. Plants were
prelabeled under steady-state conditions, with NH
 provided externally at 10 mM. Plots have been corrected for specific
activities of 13N tracer (2, 21), allowing a direct
comparison of initial efflux rates by inspection of the
y-intercepts of the regression lines.

