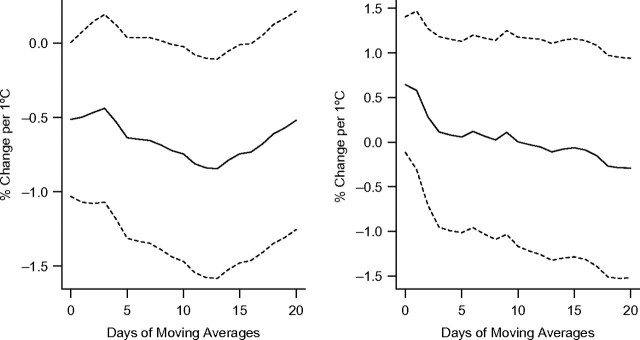
Figure 1.
Percent change in the standard deviation of normal-to-normal beat intervals per 1°C increase in apparent temperature at different daily moving averages in the warm (left) and cold (right) seasons, Normative Aging Study, Boston, Massachusetts, 2000–2008. Results were adjusted for age, body mass index, mean arterial pressure, fasting blood glucose, cigarette smoking (never, former, or current smoker), alcohol consumption (≥2 drinks per day; yes/no), use of β-blockers, calcium channel blockers, and angiotensin-converting enzyme inhibitors, examination room temperature, and season. Dashed lines, 95% confidence interval.

