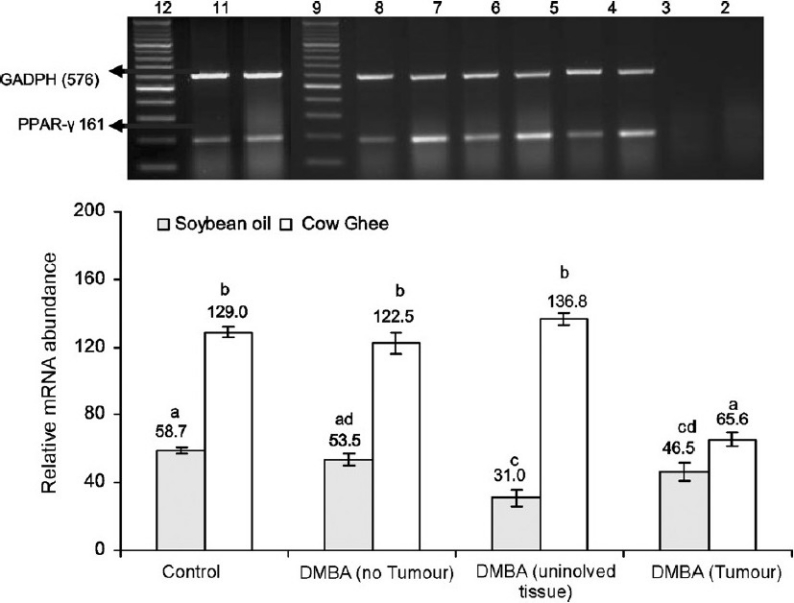
Fig. 3.

Effect of feeding cow ghee versus soybean oil on the expression of PPAR-γ in rat mammary tissue of control and DMBA treated rats. Lane-1, -ve RT-PCR; Lane-2, -ve PCR; Lane-3, cow ghee control; Lane-4, soybean oil control; Lane-5, cow ghee + DMBA (no tumour); Lane- 6, soybean oil + DMBA (no tumour); Lane-7, cow ghee + DMBA (uninvolved tissue); Lane-8, soybean oil + DMBA (uninvolved tissue); Lane-9, DNA ladder; Lane-10, cow ghee + DMBA (tumour); Lane-11, soybean oil + DMBA (tumour); Lane-12, DNA ladder. The relative mRNA abundance is calculated as per cent of reference gene (GADPH) expression. Values (mean ± SE for n=8) with different letters are significantly different (P<0.05).
