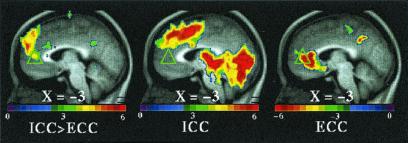
Figure 5.
Three T-statistic images comparing: ICC to ECC (see Fig. 3), and the individual task conditions, ICC and ECC, relative to their own controls (Left to Right). The green triangle (as in Fig. 1) denotes a region (Table 1) of so-called increased activity (Left) that arises entirely as the result of a decrease in ECC relative to its control (Right). Note that there is no change in the ICC relative to its control in this region (Center).

