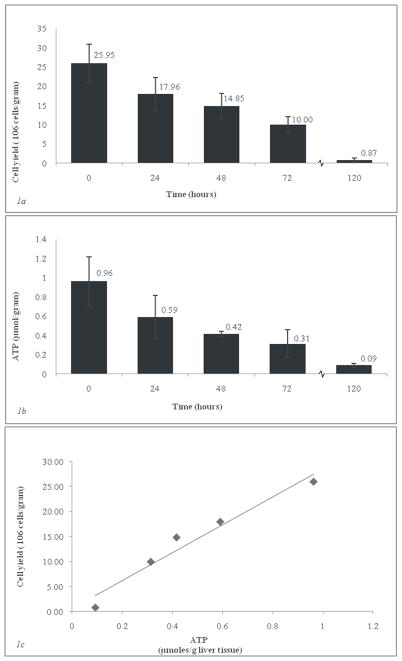
Fig. 1. Hepatocyte isolations and ATP assay for various periods of SCS. Error bars reflect standard deviation.
Fig. 1a) Cell yield after percoll-purification (>90% viability, n=3 per time point). Depicted are numbers of viable hepatocytes (>90% viability) per time point (106 cells/g).
Fig. 1b) Average ATP per gram of liver tissue (n=3 livers per time point, 3 sections per liver.
Fig. 1c) Cell yield in 106 cells/gram vs. Average ATP per gram of liver tissue.

