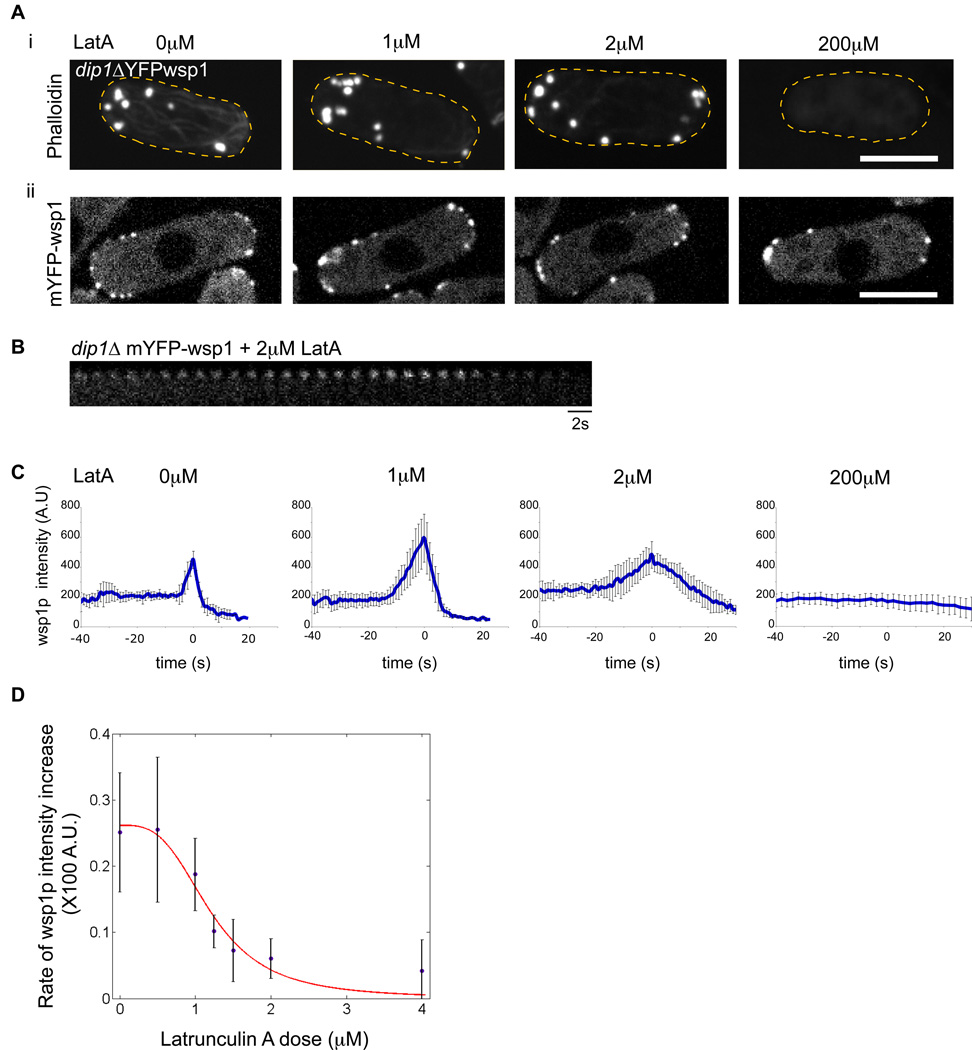
Figure 4. A switch for patch activation requires rapid actin polymerization.
(A) i) dip1Δ cells were treated with indicated concentrations of Latrunculin A (LatA) for 2 min, and then fixed and stained for F-actin with AlexaFluor 488-phalloidin. Maximum intensity projection images are shown. Note that at 1µM and 2µM doses of LatA, actin cables are disrupted, but actin patches remain. (ii) Images of mYFP-wsp1 in live dip1Δ cells treated with indicated concentrations of LatA for 2 min. Single focal plane confocal images are shown. (B) Time-lapse images of a mYFP-wsp1 patch in dip1Δ cell treated with 2µM LatA. Note that the patch does not internalize and gradually disappears. (C) Effect of LatA on the dynamic behavior of mYFP-wsp1 patches over time in dip1Δ cells. Cells were treated with indicated concentrations of LatA for 2 min and then imaged. Graphs show mean fluorescence intensities plotted over time, where t=0 at the peak of intensity. n=8 patches. (D) Effect of LatA on the rate of increase of mYFP-wsp1. Cells were treated with doses of LatA for 2 minutes and then imaged. Rates of increase of mYFP-wsp1 intensity leading up to peak at t=0 (e.g. the slopes of the upward part of the curves in C) were measured for each patch (n=8 patches at each dose). The average rates were used to fit a Hill curve using the formula f(x)= c*((Cλ/(Cλ + xλ))) with the following parameters C (critical LatA concentration) = 1.201, c (fitting parameter) = 0.2616 and λ (Hill co-efficient) = 3.18. Error bars = SD. Scale bars = 5µm.

