
Figure 2.
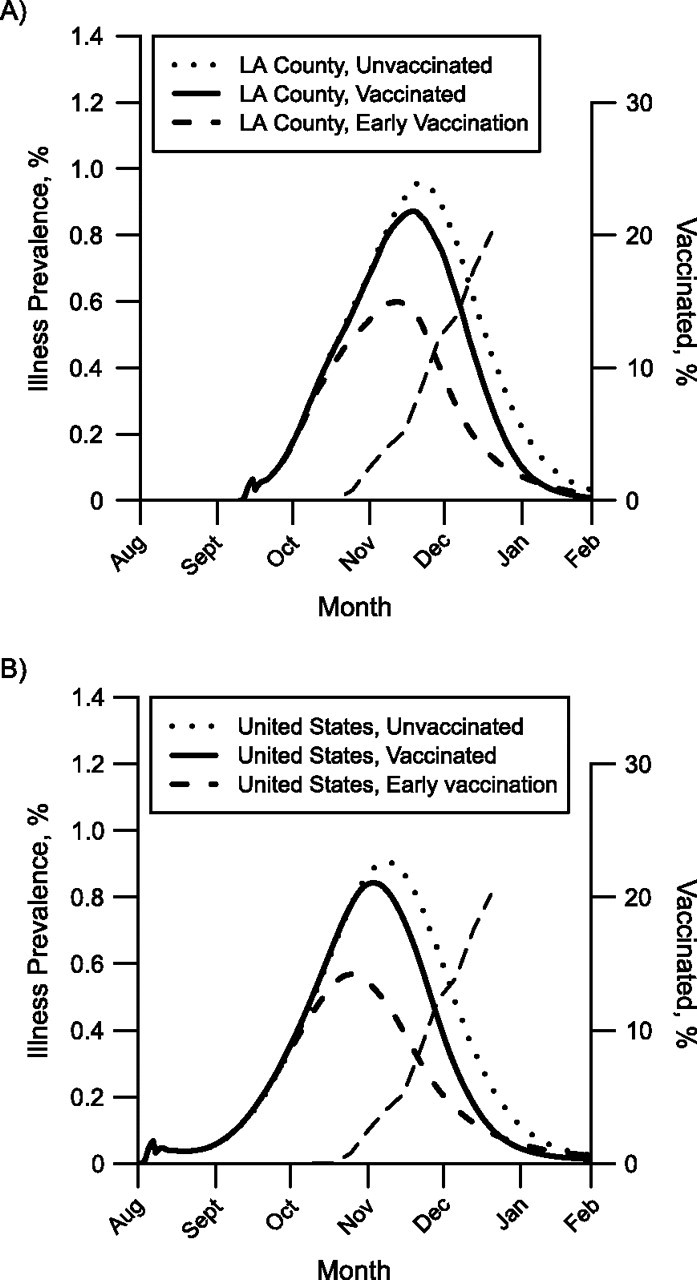
Simulated effect of the 2009 mass vaccination campaign against pandemic influenza A (H1N1) on illness prevalence in A) Los Angeles (LA) County, California, and B) the continental United States. Each curve plots the simulated prevalence of pandemic H1N1 from a single stochastic simulation. The solid curves show simulated illness prevalence when vaccination begins on October 9. The dotted curves show simulated illness prevalence when there is no vaccination. The dashed curves show simulated prevalence when vaccination begins 1 month earlier (September 9). The thin dashed curves running diagonally upwards show the fraction of the population vaccinated, assuming 1 dose per person.