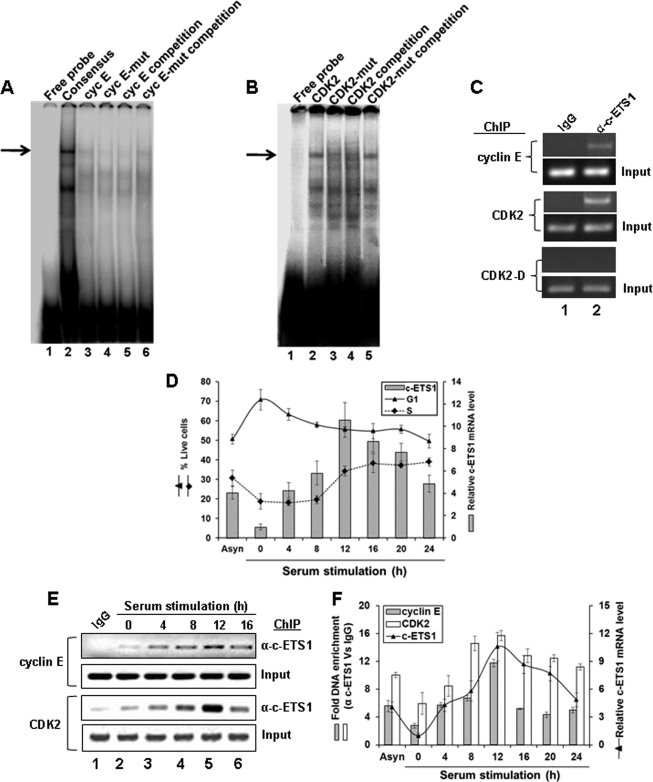
FIGURE 3.
Kinetics of c-ETS1 expression and recruitment to cyclin E and CDK2 promoters during cell cycle. A and B, EMSA to show the binding of a γ-32P-labeled Consensus (A, lane 2), WT c-ETS1 element of cyclin E (Cyc E; A, lane 3), and CDK2 (B, lane 2) to the nuclear extracts of Huh7 cells. Cold competition with 100-fold molar excess of unlabeled WT and mut c-ETS1 elements of cyclin E (A, lanes 5 and 6) and CDK2 (B, lane 4 and 5) were used to show the binding specificity. Impaired binding by γ-32P-labeled mut c-ETS1 oligonucleotides of cyclin E (A, lane 4) and CDK2 (B, lane 3) further ensured the specific binding of WT c-ETS1 oligonucleotides. The EMSA primers are given in supplemental Table 2. Arrows indicate the positions of the c-ETS1-DNA complex. C, ChIP analysis showing the recruitment of c-ETS1 on cyclin E and CDK2 promoters. IgG indicates the control antibody. D, the relative c-ETS1 mRNA level (bar) measured by qRT-PCR was plotted against percent G1 and S-phase Huh7 cells that were serum-starved for 48 h and stimulated for indicated time points. E, semiquantitative ChIP-PCR analysis showing the recruitment kinetics of c-ETS1 on cyclin E and CDK2 promoters. Huh7 cells were subjected to ChIP-PCR analysis upon serum stimulation for the indicated time periods. IgG indicates the control antibody. F, ChIP-qPCR showing fold DNA enrichment over mock due to c-ETS1 occupancy on cyclin E and CDK2 promoters (bars) was plotted against the relative c-ETS1 mRNA level (line) measured by qRT-PCR. Data shown in D and F are the mean ± S.D. of three independent experiments.

