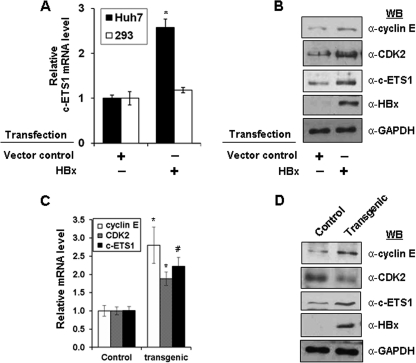
FIGURE 7.
Deregulation of c-ETS1 proto-oncogene by HBx. A, the relative mRNA levels of c-ETS1 were measured by qRT-PCR in both Huh7 and HEK293 cells transfected with HBx. C, the relative mRNA levels of cyclin E, CDK2, and c-ETS1 were measured by qRT-PCR in the liver samples of control and X15-Myc transgenic mice. B and D, immunoblots to show the levels of cyclin E, CDK2, c-ETS1, HBx, and GAPDH in the Huh7 cells transfected with HBx (B) or in the liver samples of 1-month-old X15-Myc transgenic mice (D). Data shown in A and C are the mean ± S.D. of three independent experiments. An asterisk and number sign indicate statistically significant difference at p < 0.05 and p < 0.01, respectively.

