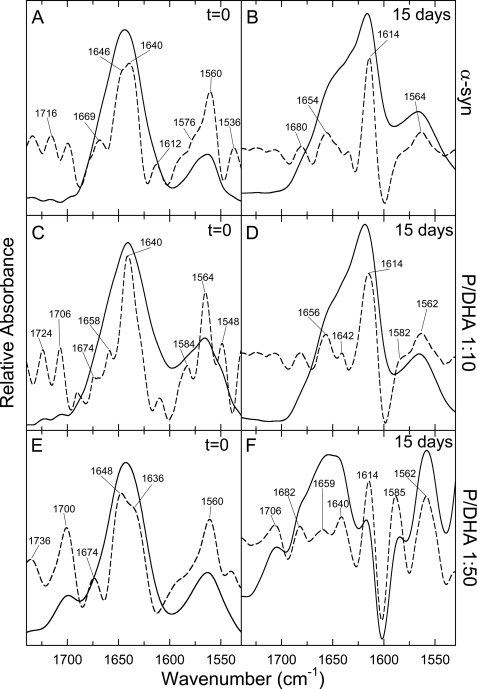
FIGURE 3.
FTIR spectroscopy. FTIR spectra of α-syn in the absence (A and B) and in the presence of DHA in ratio P/DHA of 1:10 (C and D) and of 1:50 (E and F) are shown. The spectra were obtained on samples just prepared (left column) and after 15 days of incubation (right column). The second derivatives of the amide I bands (dashed line) were used to identify the different spectral components. For details about samples preparation see “Experimental Procedures.”

