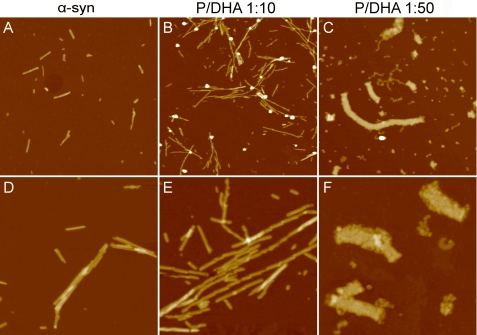
FIGURE 5.
Analysis of the aggregate morphology by AFM. Tapping mode AFM images (height data) of α-syn aggregates were obtained after 1 month of incubation in the absence (A and D) and in the presence of DHA at a molar ratio P/DHA 1:10 (B and E) and 1:50 (C and F). Scan size was 2.4 μm (A–C) and 1.0 μm (D–F); Z range was 25 nm (A, B, D, and E) and 30 nm (C and F).

