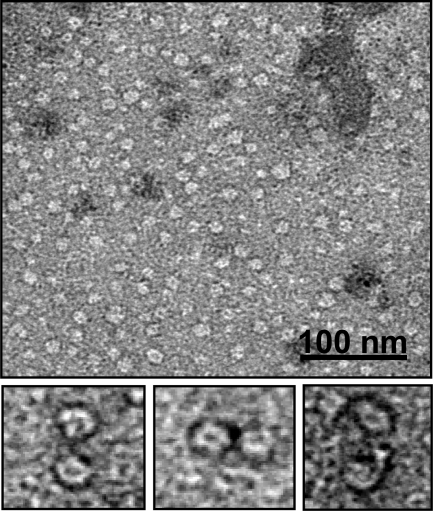
FIGURE 8.
TEM image of α-syn oligomers isolated by gel filtration (Fig. 7C, RT of 20.5 min) after 24 h of incubation of α-syn in the presence of DHA (P/DHA 1:50). A gallery of panels relative to magnification of some annular structures is reported below.

