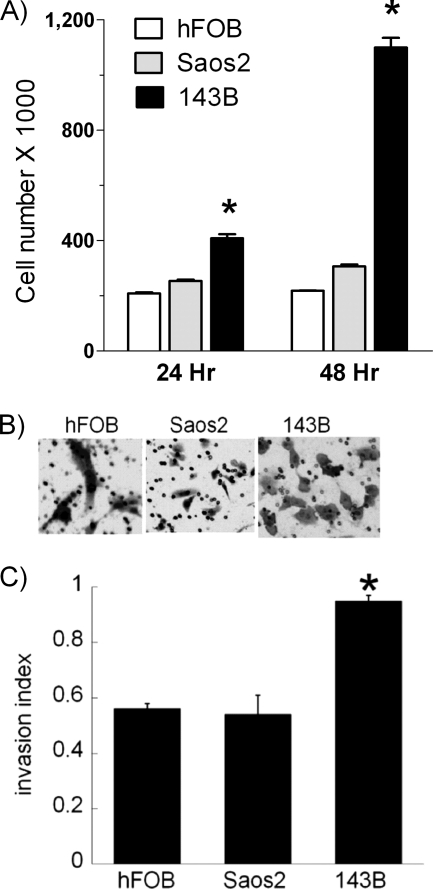
FIGURE 1.
Proliferation rate and invasive potential of osteosarcoma cells. A, hFOB, Saos2, and 143B cells were seeded in 6-well plates at the density of 200,000 cells per well. After 24 or 48 h of incubation, cells were trypsinized, harvested, and counted using an automatic cell counter. B, hFOB, Saos2, and 143B cells were seeded onto either control or Matrigel-coated membranes of the invasion chambers at the density of 50,000 cells per chamber. After 48 h of incubation, cells that have penetrated through the membranes were stained with toluidine blue to assess the invasive potential. C, quantitative analysis of the invasive potential was performed by calculating the invasion index, as described under “Experimental Procedures.” Values represent the means ± S.E.; n = 3–4 independent wells. *, p < 0.05, as compared with hFOB cells.

