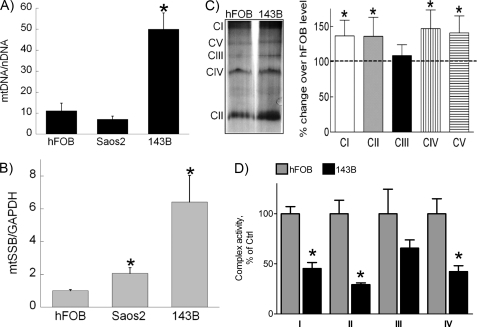
FIGURE 4.
Levels of mitochondrial DNA, mtSSB, and respiratory complexes in osteosarcoma cells. A, total cellular DNA was isolated and subjected to real-time PCR analysis to determine the amount of mtDNA in the studied cells. The data are expressed as a ratio between the amounts of ND1, an mtDNA-encoded gene, and β-actin, a nuclear-encoded gene. B, total cellular RNA was isolated and reverse-transcribed. Real-time PCR analysis was performed to determine expression levels of several genes implicated in mitochondrial biogenesis. Experimental data were normalized to the expression of GAPDH. C, mitochondria were isolated from hFOB and 143B cells, and mitochondrial proteins were separated using non-denaturing gel electrophoresis. The plot depicts densitometric changes in protein level of 143B cells compared with hFOB cells. D, isolated mitochondria was used for assay of enzyme activities of respiratory complexes I-IV in hFOB and 143B cells, as described under “Experimental Procedures.” The data are expressed as percentage of activity compared with hFOB cells. Values represent the means ± S.E.; n = 3 independent measurements. *, p < 0.05, as compared with hFOB cells.

